Introduction
OpenStreetTouch is a program to extract geographical data from OpenStreetMap. It allows to extract both data on public transport (transport map and names of stations) but also to extract maps according to a defined zone by a radius from a central point to visualize the position of roads and buildings.
The generated SVG files are therefore compatible with the programs Image2Touch or DesktopBraillerap. The main objective is to extract these data to create tangible maps, so that they are accessible to unsighted people.
In many cities, public transport maps are not available in braille or in a format adapted to visually impaired people. Most of the necessary data are available in OpenStreetMap under Open Database license. OpenStreetTouch aims to extract these data to create an accessible public transport map.
Here is an example with DesktopBrailleRAP on a residential area in France
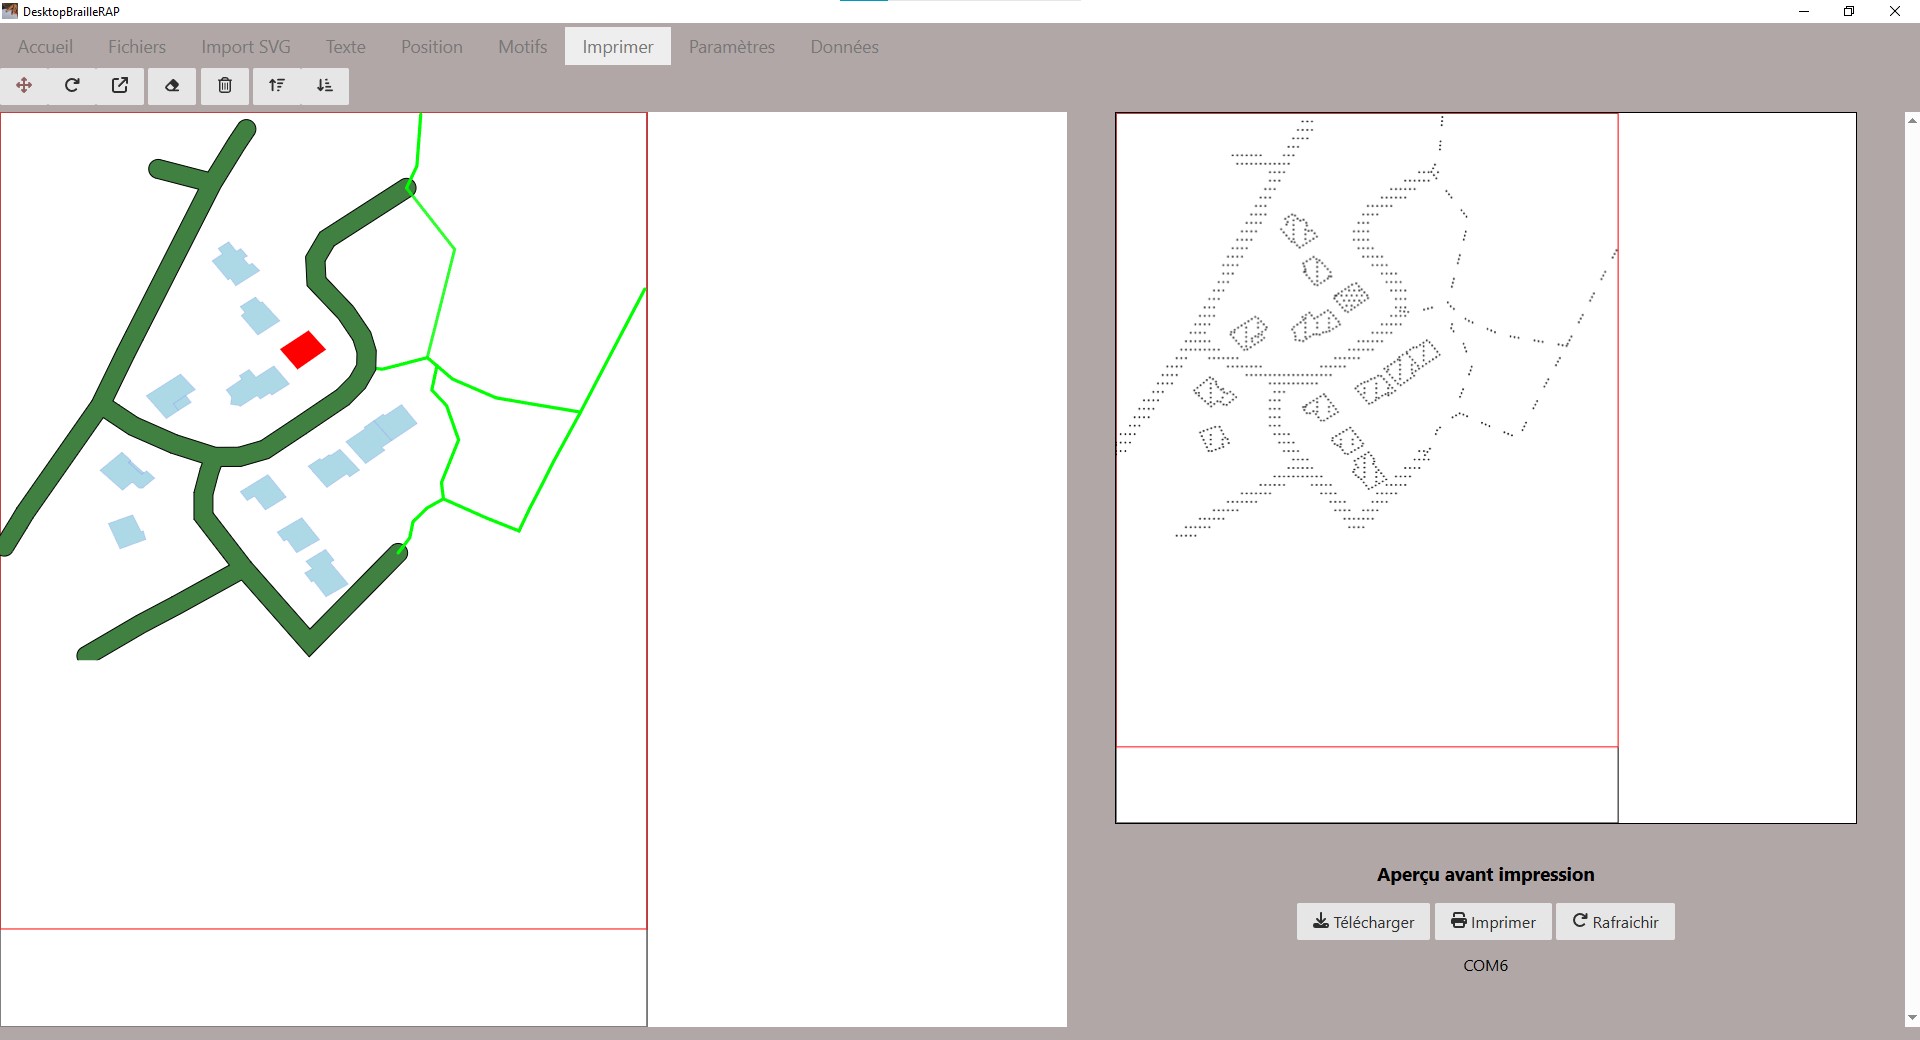 Example of a map extracted with OpenStreetTouch exploited with DesktopBrailleRap in order to emboss this map with the open source embosser BrailleRap
Funding
This project is funded through NGI0 Entrust, a fund established by NLnet with financial support from the European Commission’s Next Generation Internet program. Learn more at the NLnet project page.


Features
Create an SVG map from public transport data. These SVG files can then be used to create a tangible map.
Extract stations names from public transport data..
Extract a map of a small area to create an accessible representation of the place (max radius of 2000m).
Graphical interface presentation
Interface composed of a menu with a screen divided into two parts (left and right). On the left, the parameter settings and on the right, the rendering window.
The main menu is composed of 5 tabs that we will detail: Home/Transport/Map/Settings/Exit.
Home:
The home page presents the version number of the program, the logos of the partners (My Human Kit and NLNET Foundation), and the link to the OpenStreetMap license, the source of the data extracted by the OpenStreetTouch program
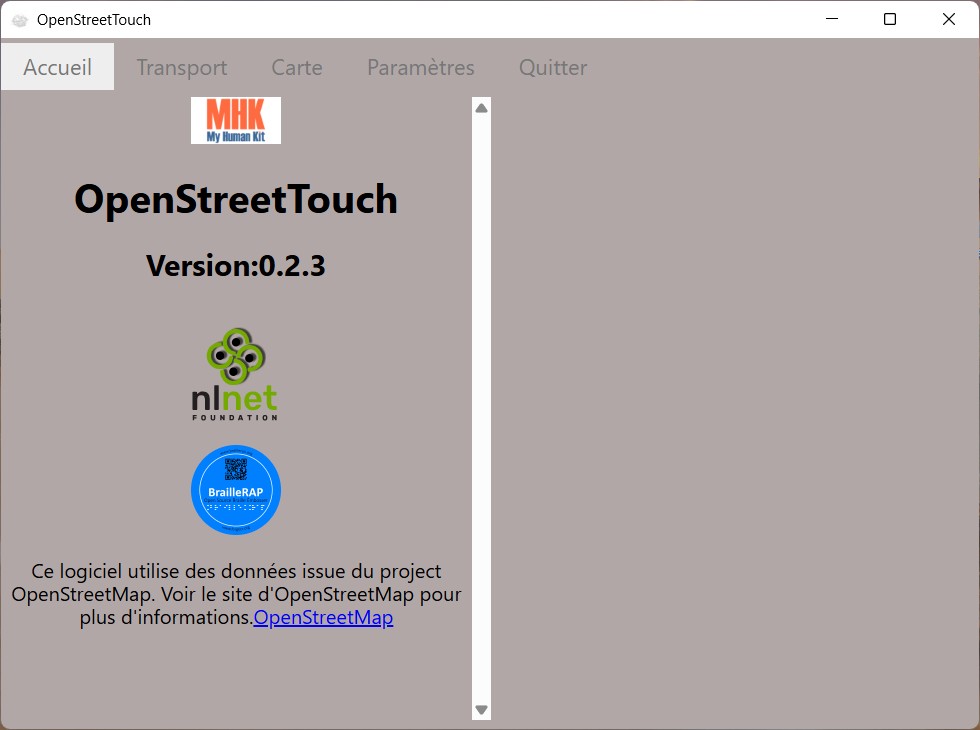 Home screenshot
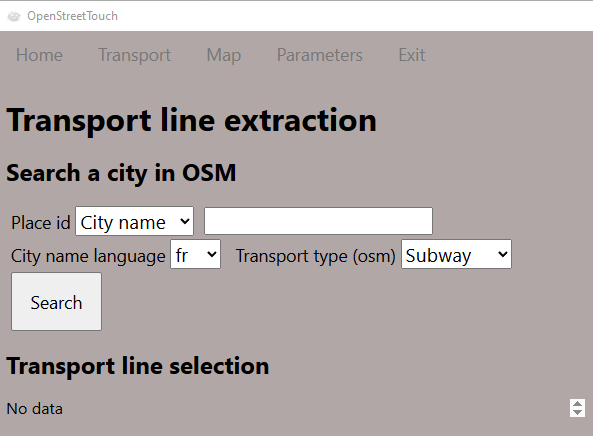
Transport
This tab allows you to extract the transport lines of a city according to the parameters defined by the user.
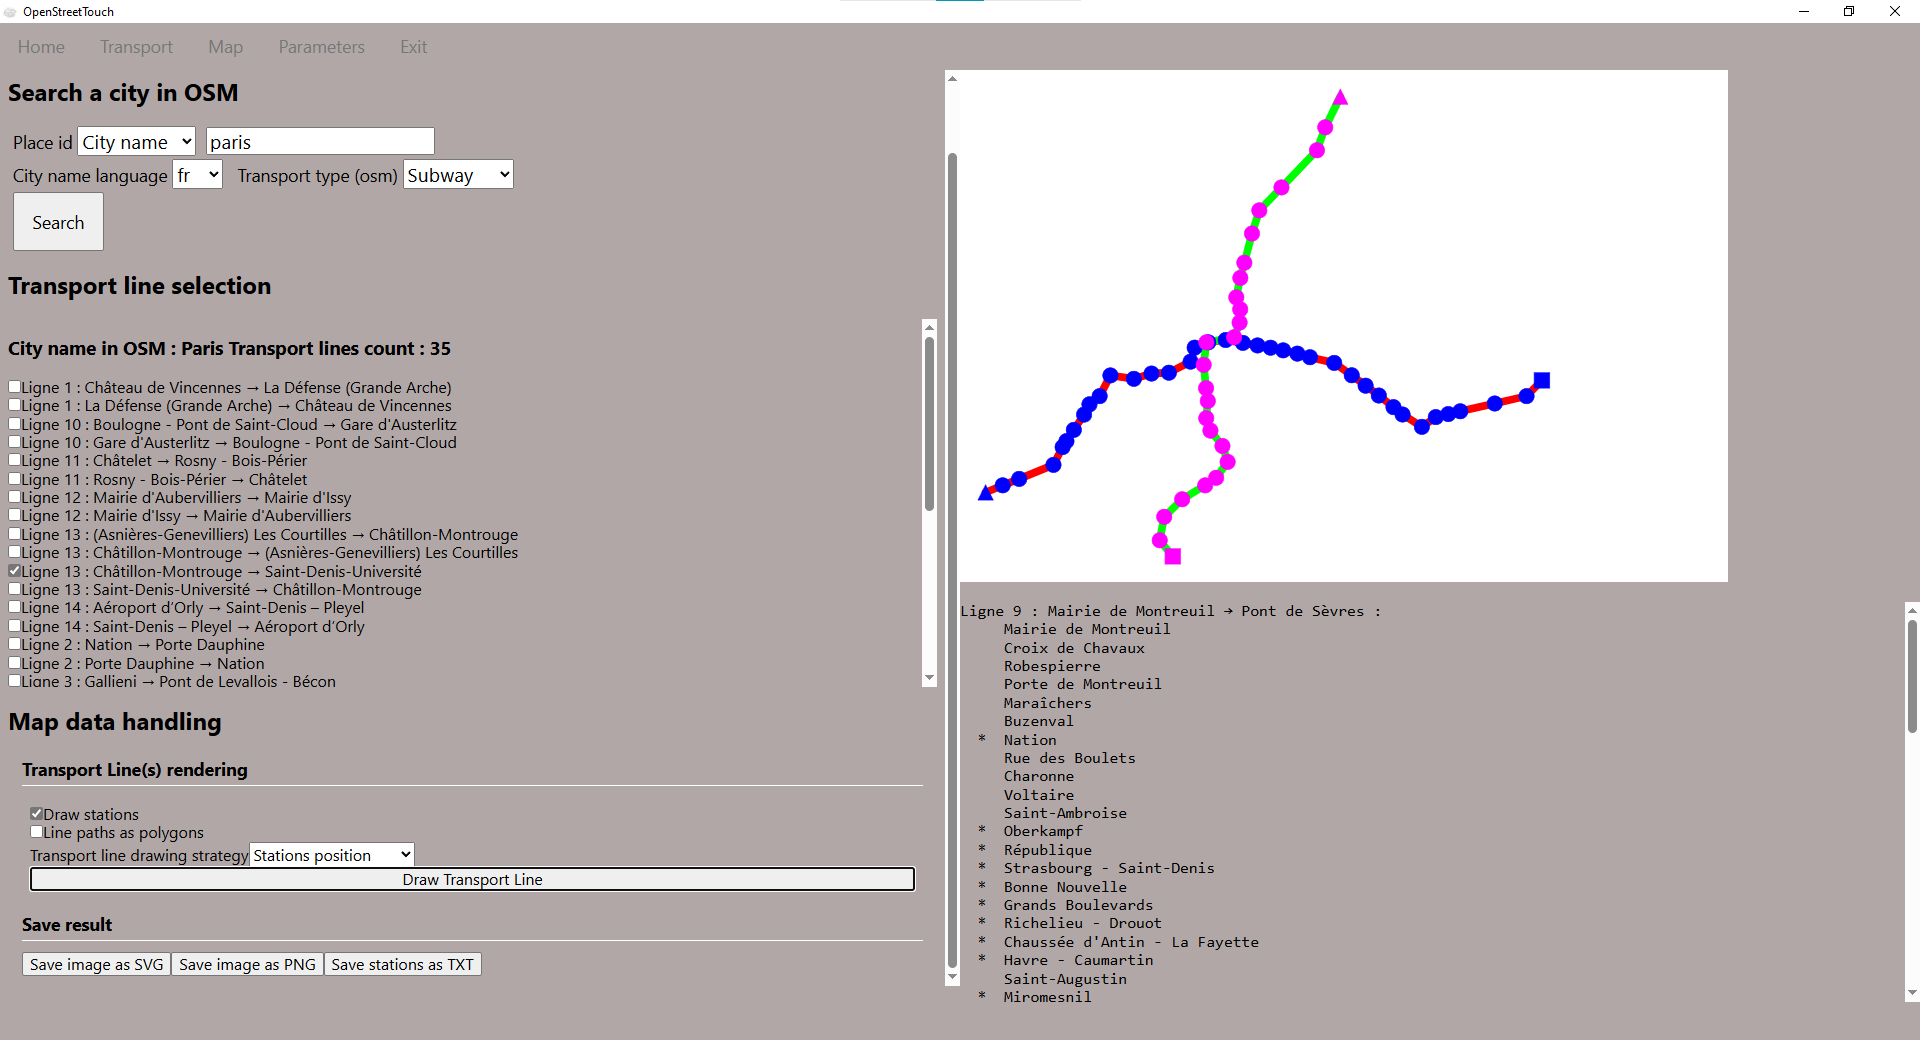 Using the Transport tab with the Paris Metro
1- Define the extraction settings
 On the left, the extraction data parameters
Place ID :
Dropdown menu to choose whether the search is by city name or Wikidata ID (useful in the case where several cities have the same name)
Empty text field to write the city name or the corresponding ID.
City language : Dropdown menu to define the city language (The language used to express the name of the city (fr for Londres and en for London for example)
Transport type (OSM) : Dropdown menu to define the type of transport Open Street Map to extract (Metro, Funicular, Bus/Car, Tramway, Train, Light train, Monorail, Ferry)
2- Click on the Search button and wait for the requested data to appear
Interface with the Search button
3-Transport line display settings
Extracting lines selection
Once the search is complete, check each of the lines to be included in the extraction
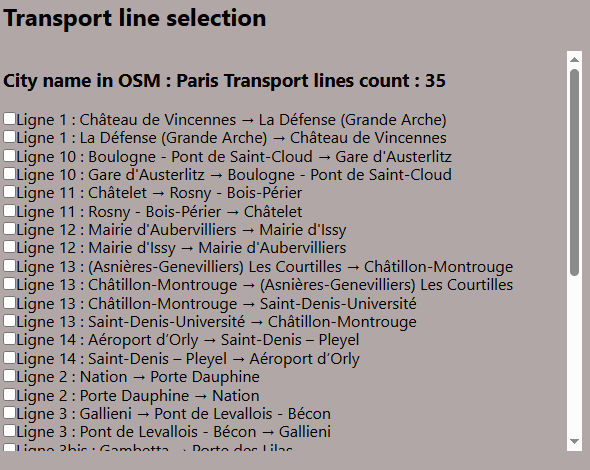 Interface to choose the different transport lines to extract with the check boxes
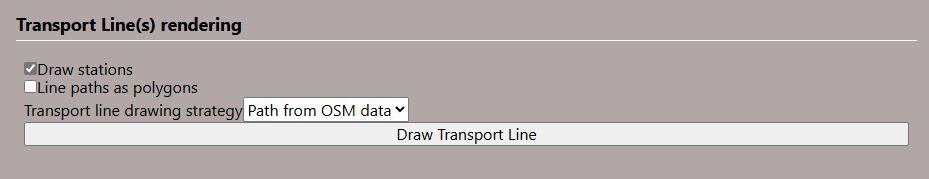
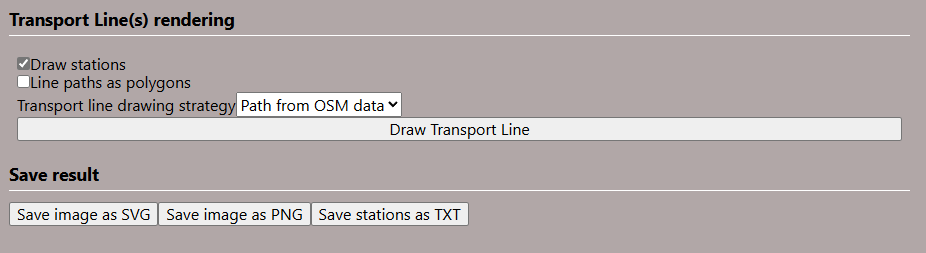
Transport line rendering setup
Draw stations : check this option to make the stations displayed on the map
Line paths as polygons : check this option to draw the lines with polygons, which is equivalent to drawing them with outlines. This option is recommended to exploit this drawing with a digital machine, laser cutter for example.
Transport line drawing strategy : Dropdown menu to choose the type of rendering :
path from OSM data : faithful to the representation as it is in Open Street Map
OSM data corrected : useful when the rendering presents interruptions on the transport lines
Station positions : simplifies the drawings by connecting the stations with straight lines instead of respecting the curves
4-Draw the transport line
Draw the transport line : Click on the button to generate the rendering in the right panel.
 Button draw transport line
5-View the rendering in the right panel
The drawing of the transport lines is generated in the upper part of the right panel.
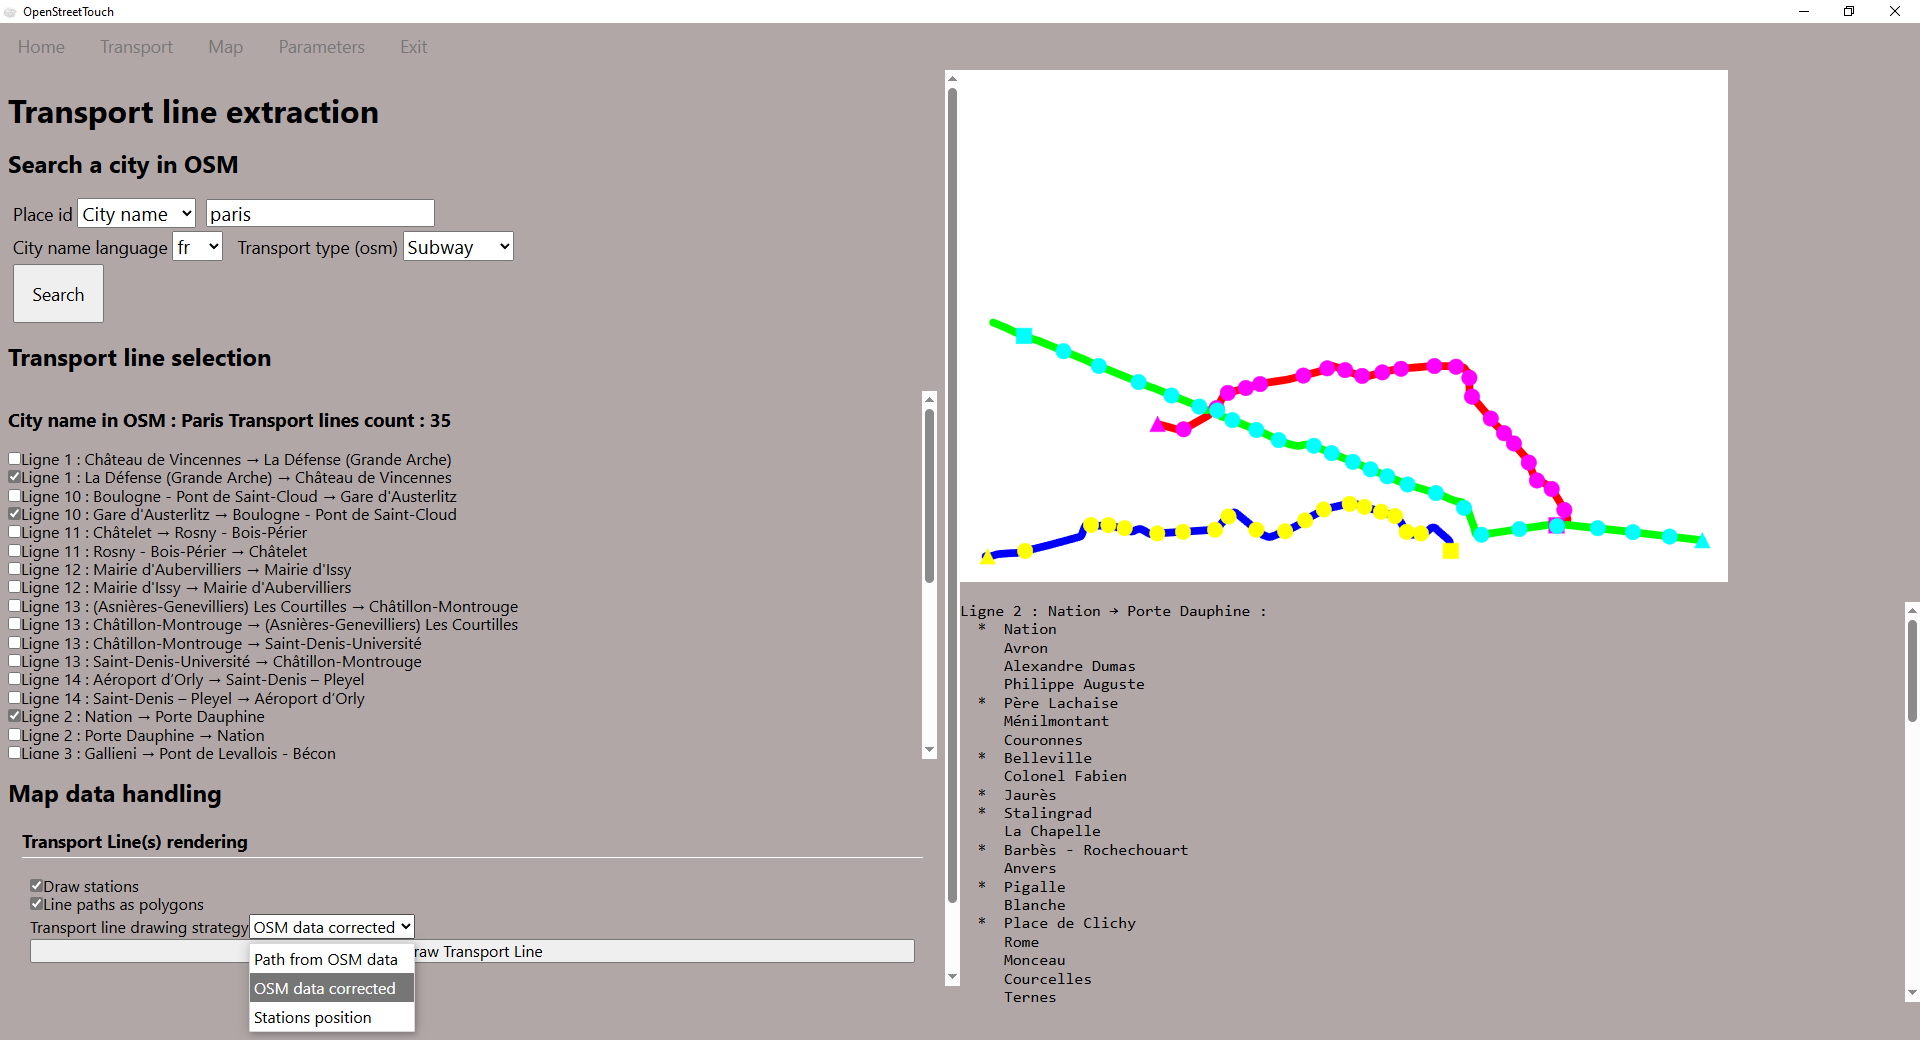 Rendering in the right panel of the chosen transport lines, with the option “draw stations” and “polygons”
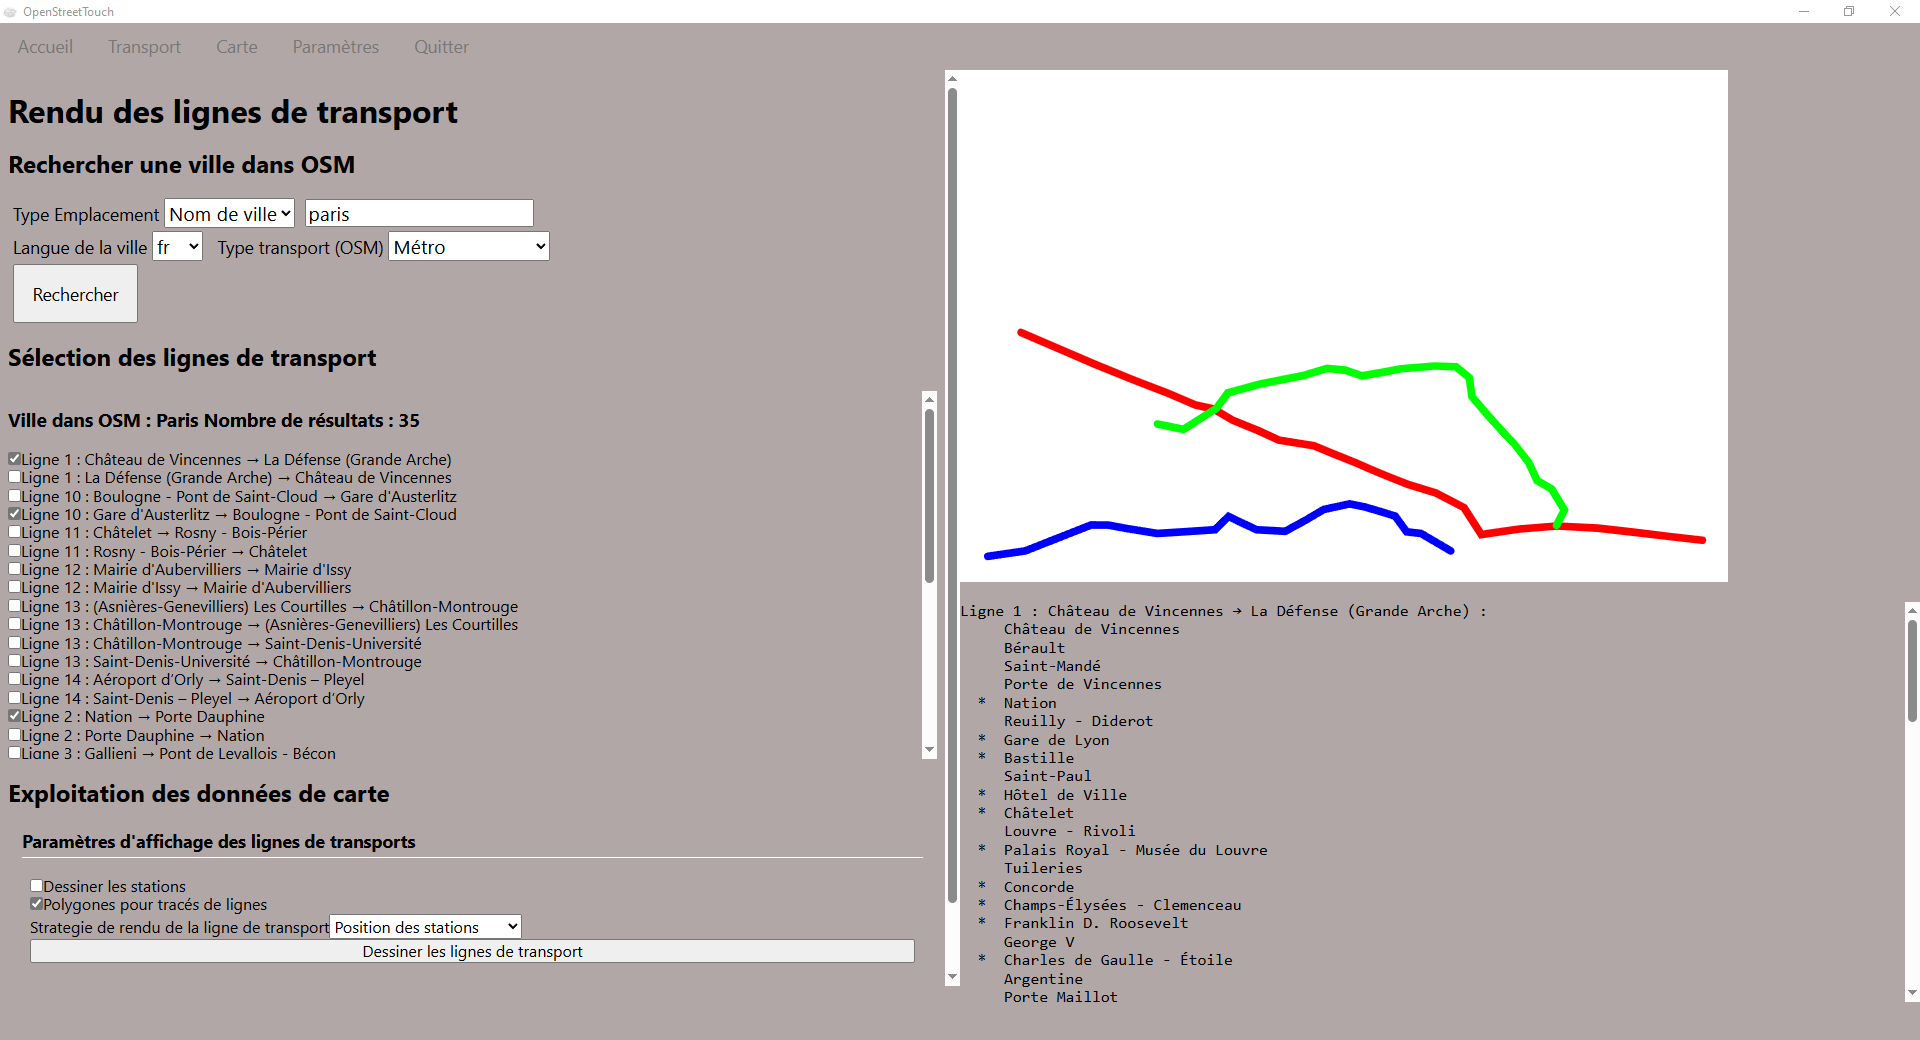 Rendering in the right panel when the option “draw stations” is not checked
Under the rendering map drawing, the name of each transport line is displayed with its direction and all its stations.
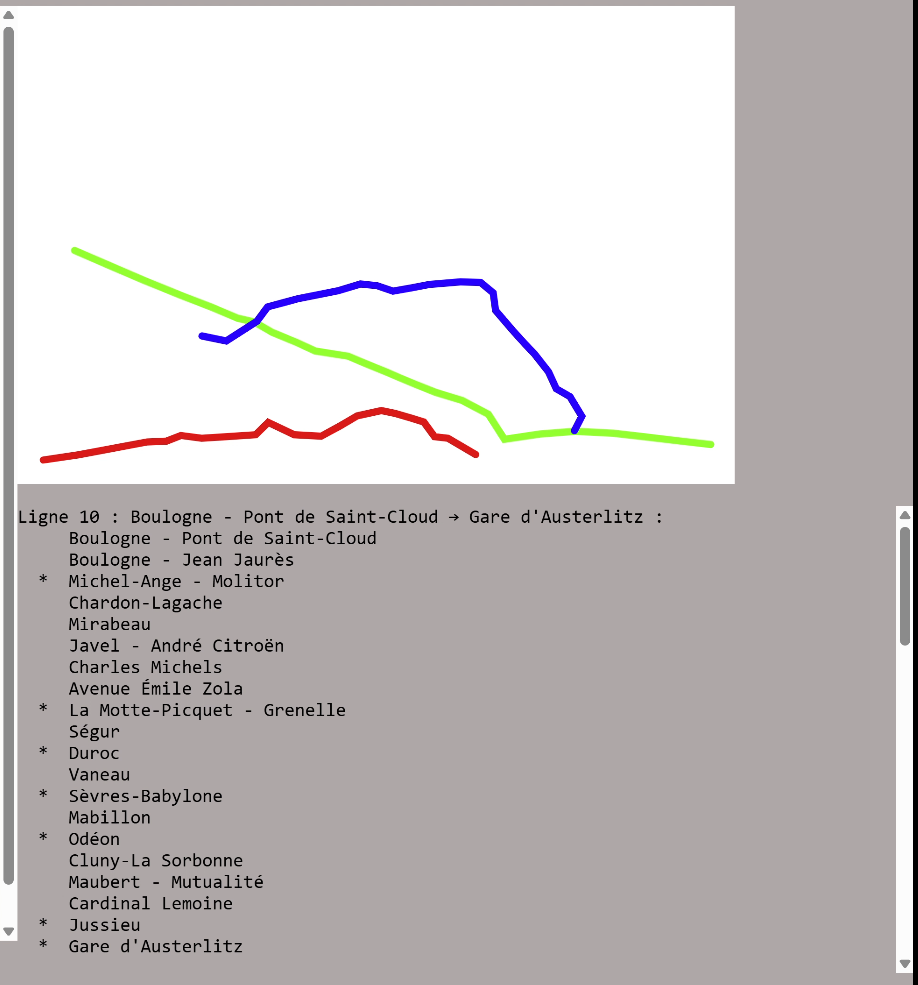 Display of the names of the stations under the drawing of the transport lines
6-Save result
Save the image in SVG : Click on the button to save the map rendering in SVG format. It is the vector format, ideal for being exploited later by numerical machines.
Note that for this button to appear, you must have generated the drawing by clicking on “Draw the/transport lines”
 Button to save the image in svg
Open the svg to see the rendering with a vector software (for example Inkscape)
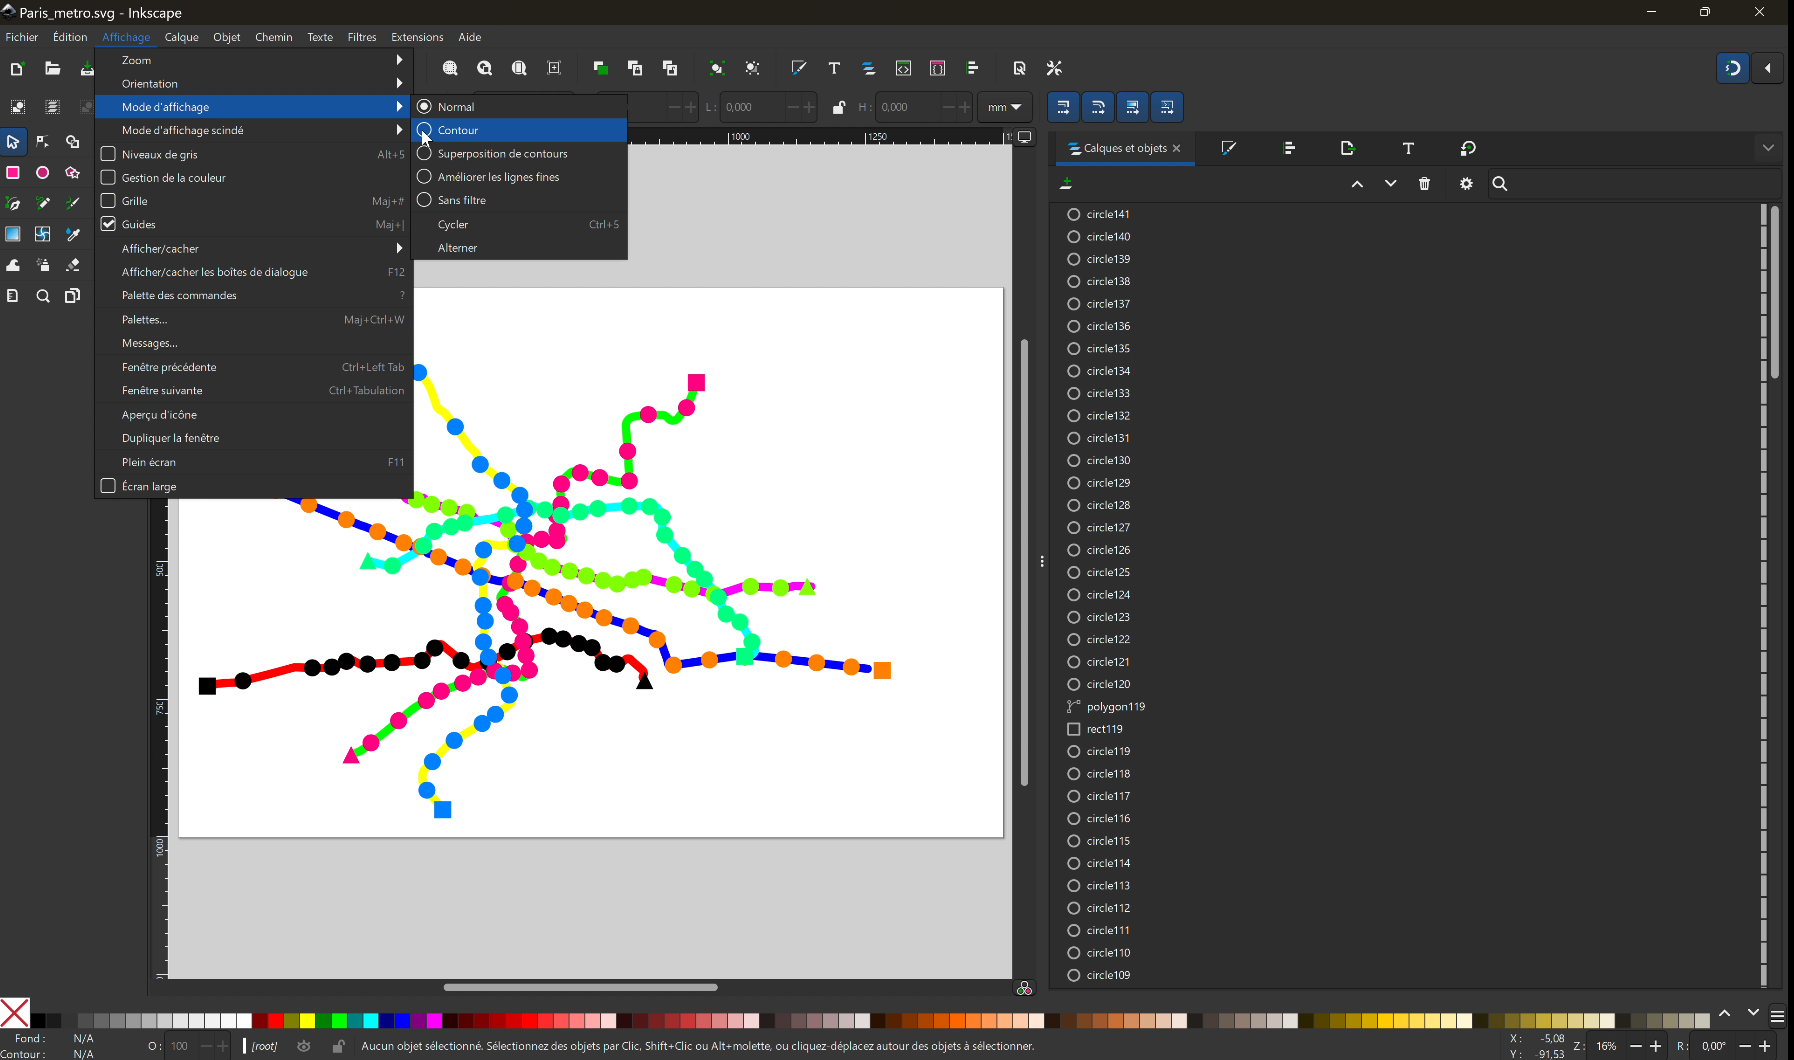 File svg opened in Inkscape. Note that in the Display>Normal mode, we do not distinguish the contours but the colors like in a raster image.
Switch to outline display mode: Menu: Display mode > Outline
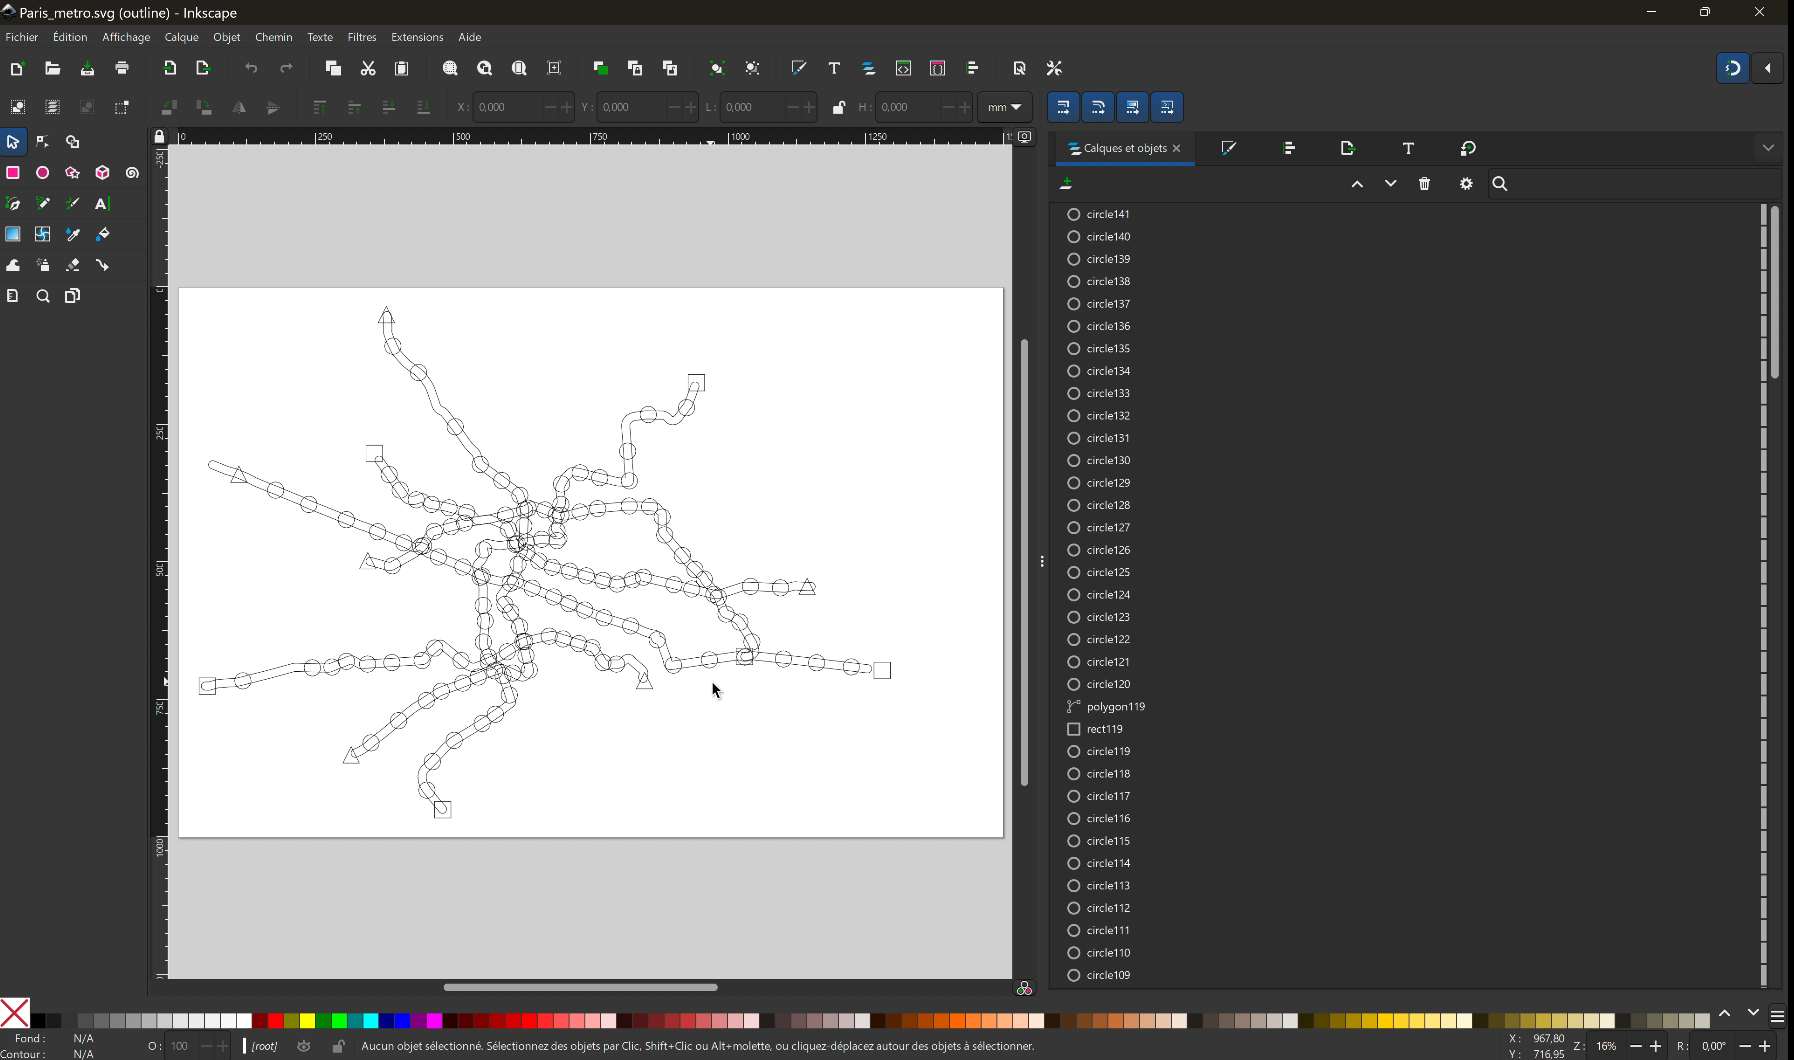 Visualization of transport lines in outline display mode in Inkscape software.
 Visualization of transport lines in Inkscape software with normal option deactivated
Save the image as PNG : Click on the button to save the rendering of the map in PNG format. This is the raster format, ready to be printed in color.
“Save the stations as TXT : Click on the button to export the entire set of existing stations on the selected lines for the rendering.
“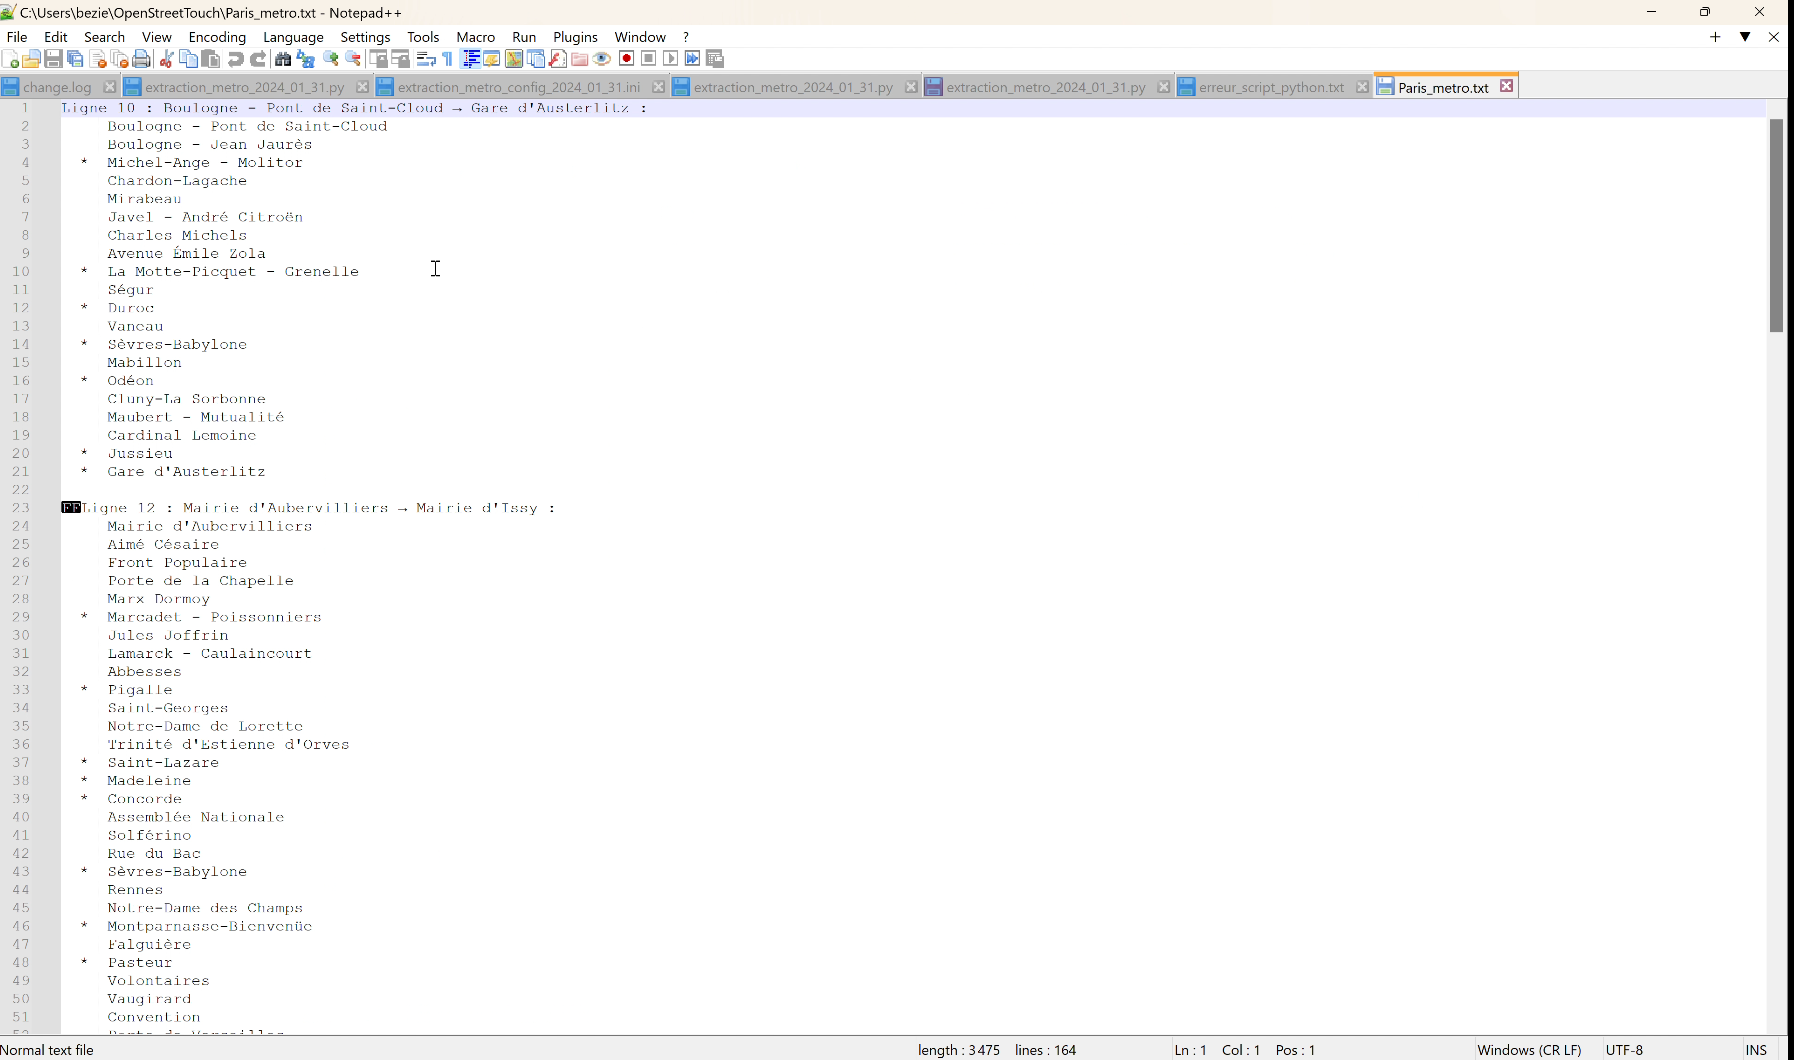 File of the names of the transport line stations, opened with a text editor
Map
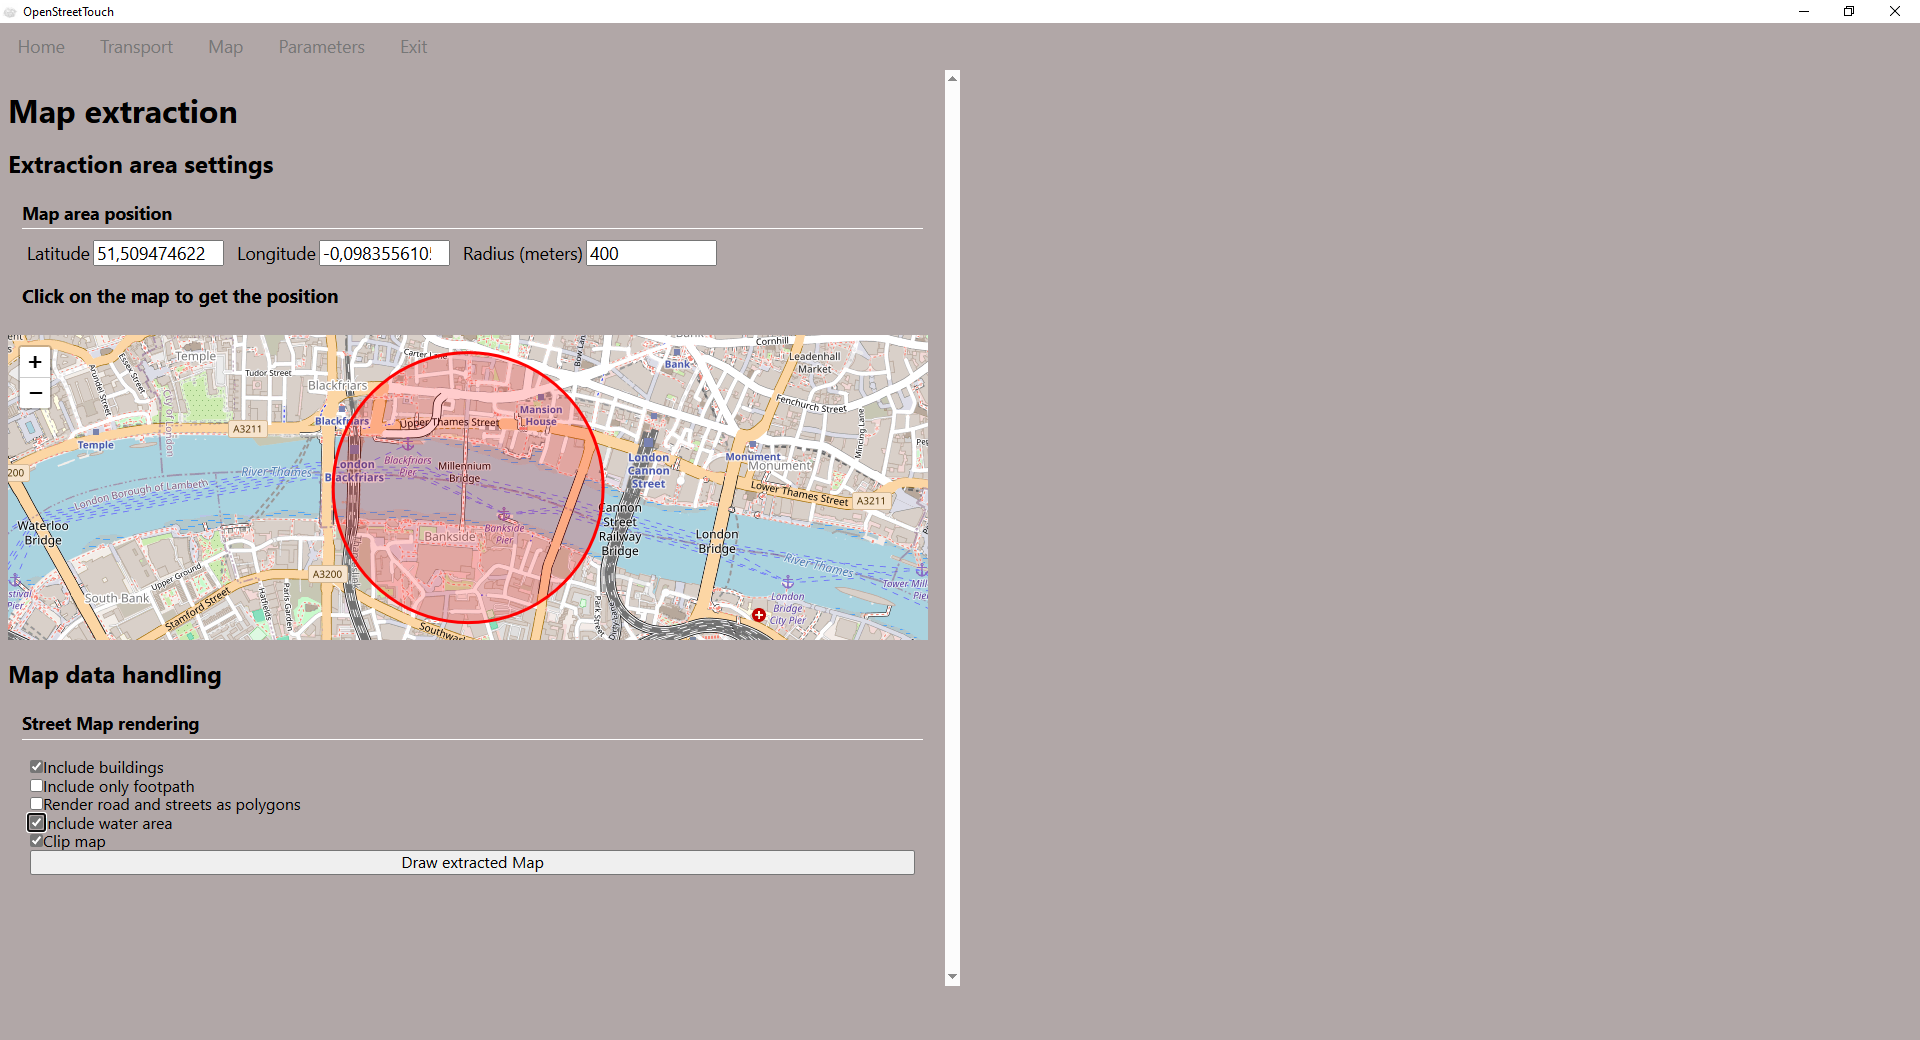
Map extraction
This tab allows you to extract a map from a central point and a radius. Note that the extracted map is rectangular (the circle traced from the radius is transformed into a rectangle for the map generation)
 Map tab screenshot
1-Set the perimeter of the desired plan
The central point can be defined in two ways :
By filling in the Latitude and Longitude fields
By clicking directly on the map and zooming with the mouse wheel (or with the + and - buttons of the interface) to be precise on the wanted position
Radius (meter) : Specify in this field the radius of data extraction to generate the map
2-Draw extracted map
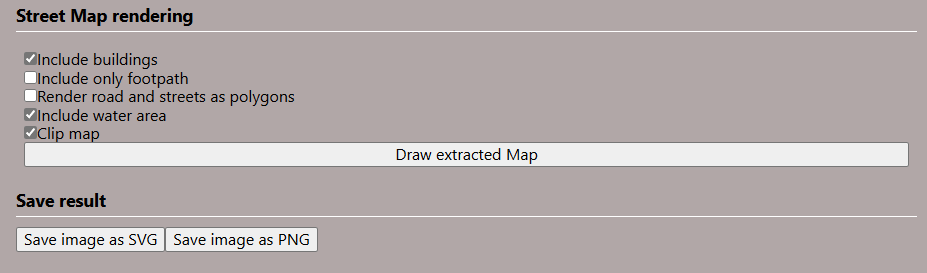
Data extraction settings
Check the following options to include them on the map.
Include buildings : Include buildings on the map
Pedestrians only : generate only pedestrian roads
Polygons for roads/paths: the polygon mode allows to generate outline more adapted to the use with a digital control machine
Include water area: include water area
Clip map: strictly respect the area of the radius even if some traces are cut
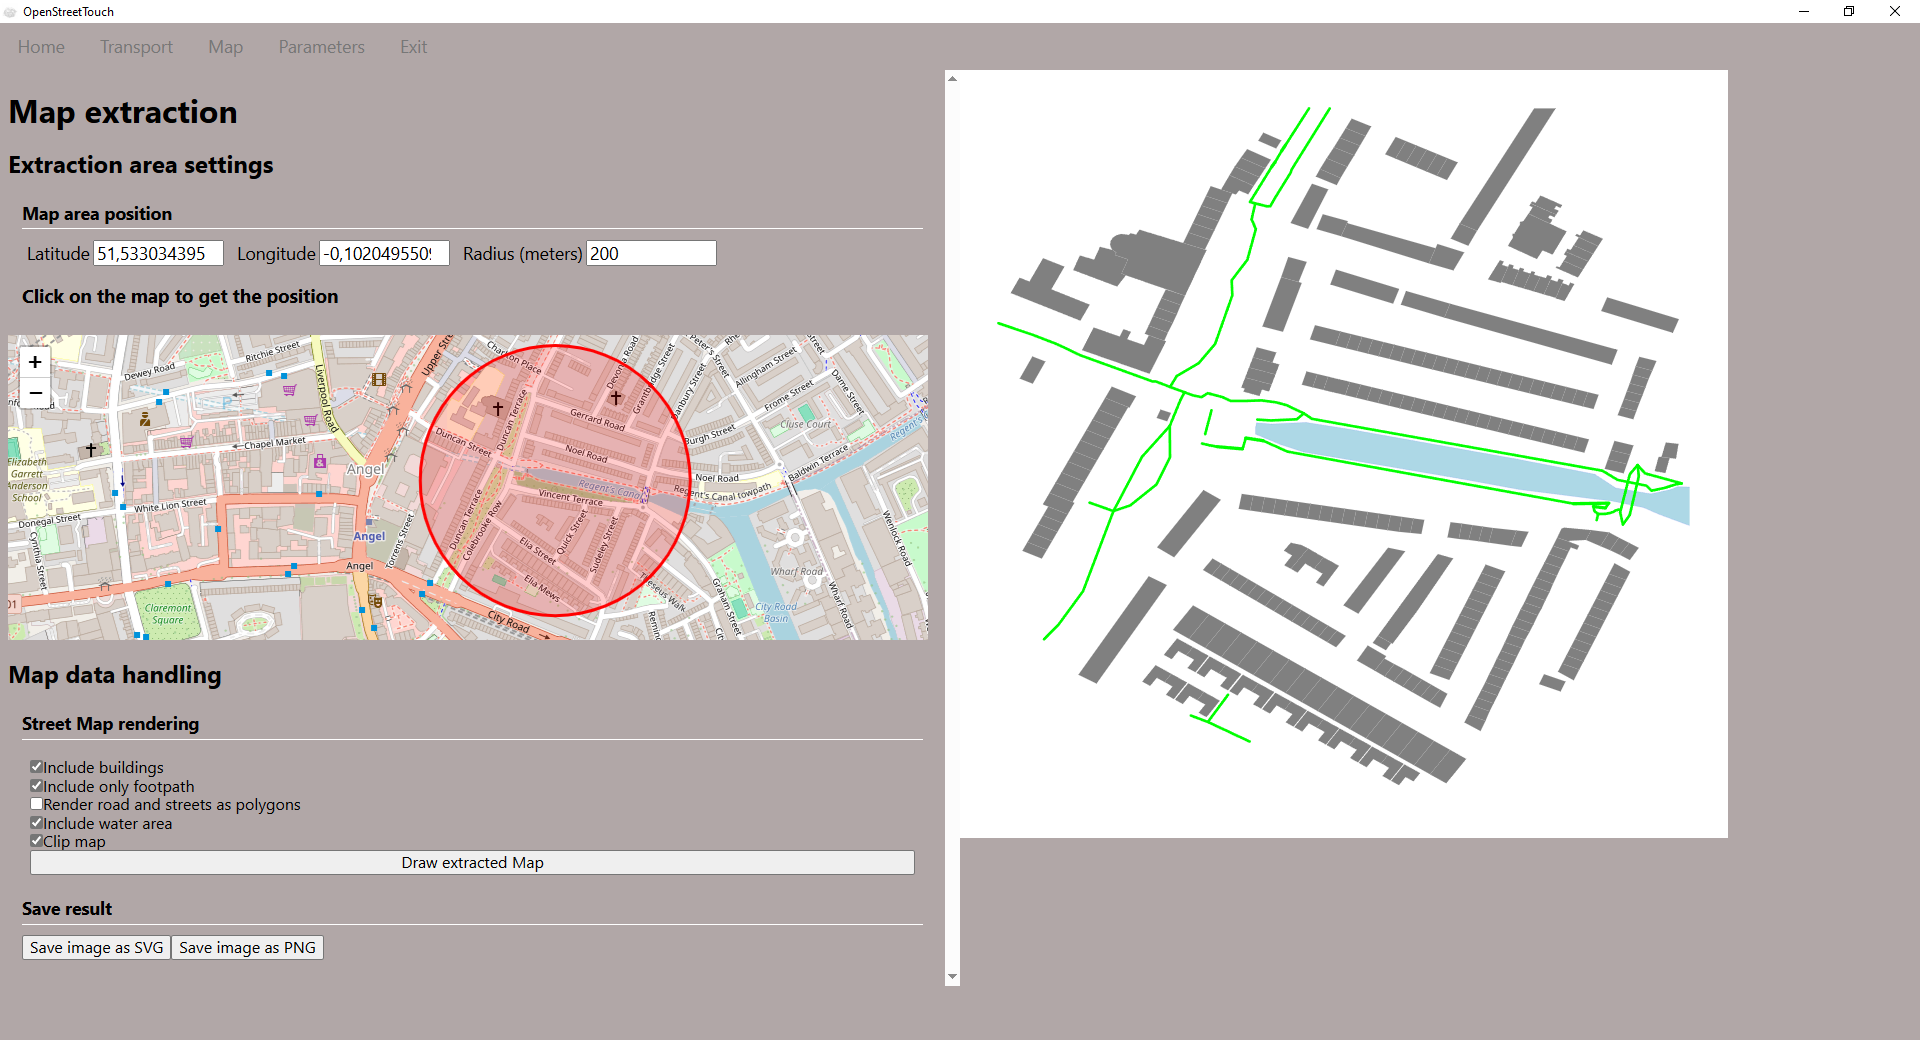
 Example of map rendering including buildings
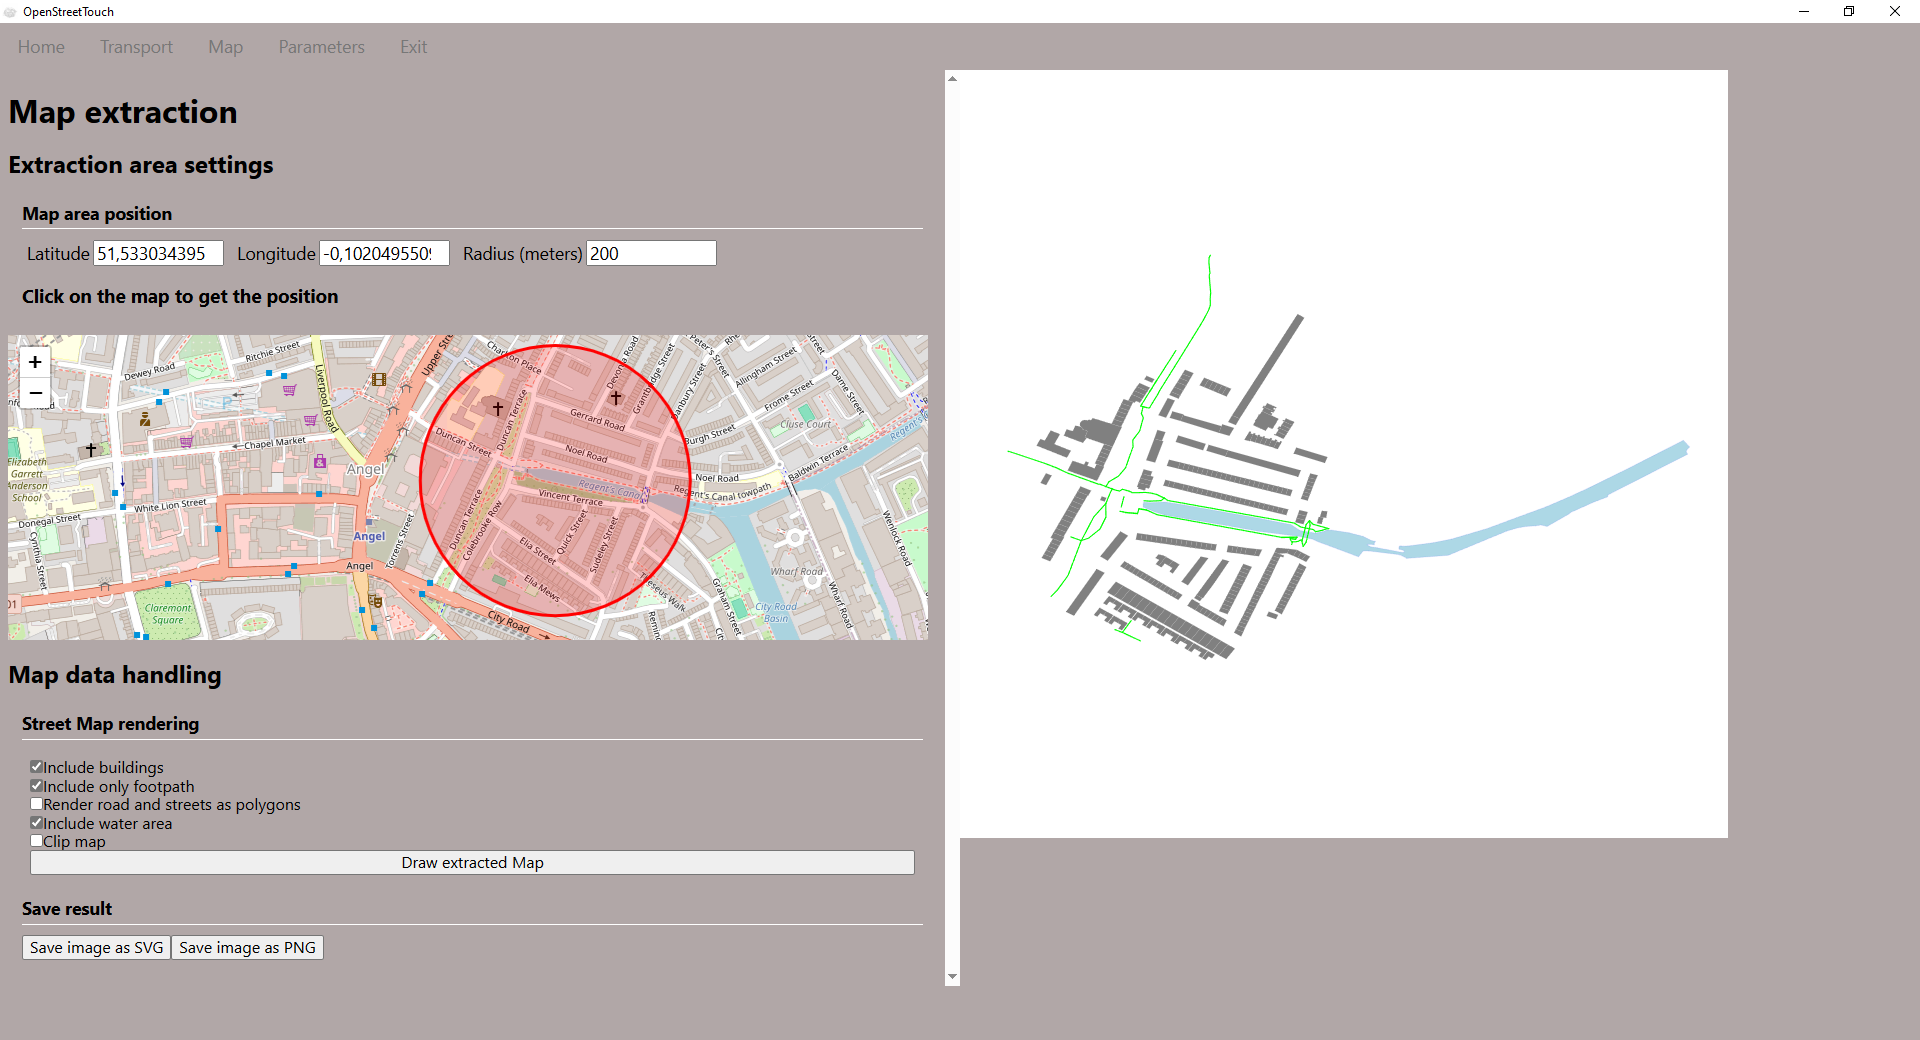 Example of map rendering including buildings and pedestrian roads only
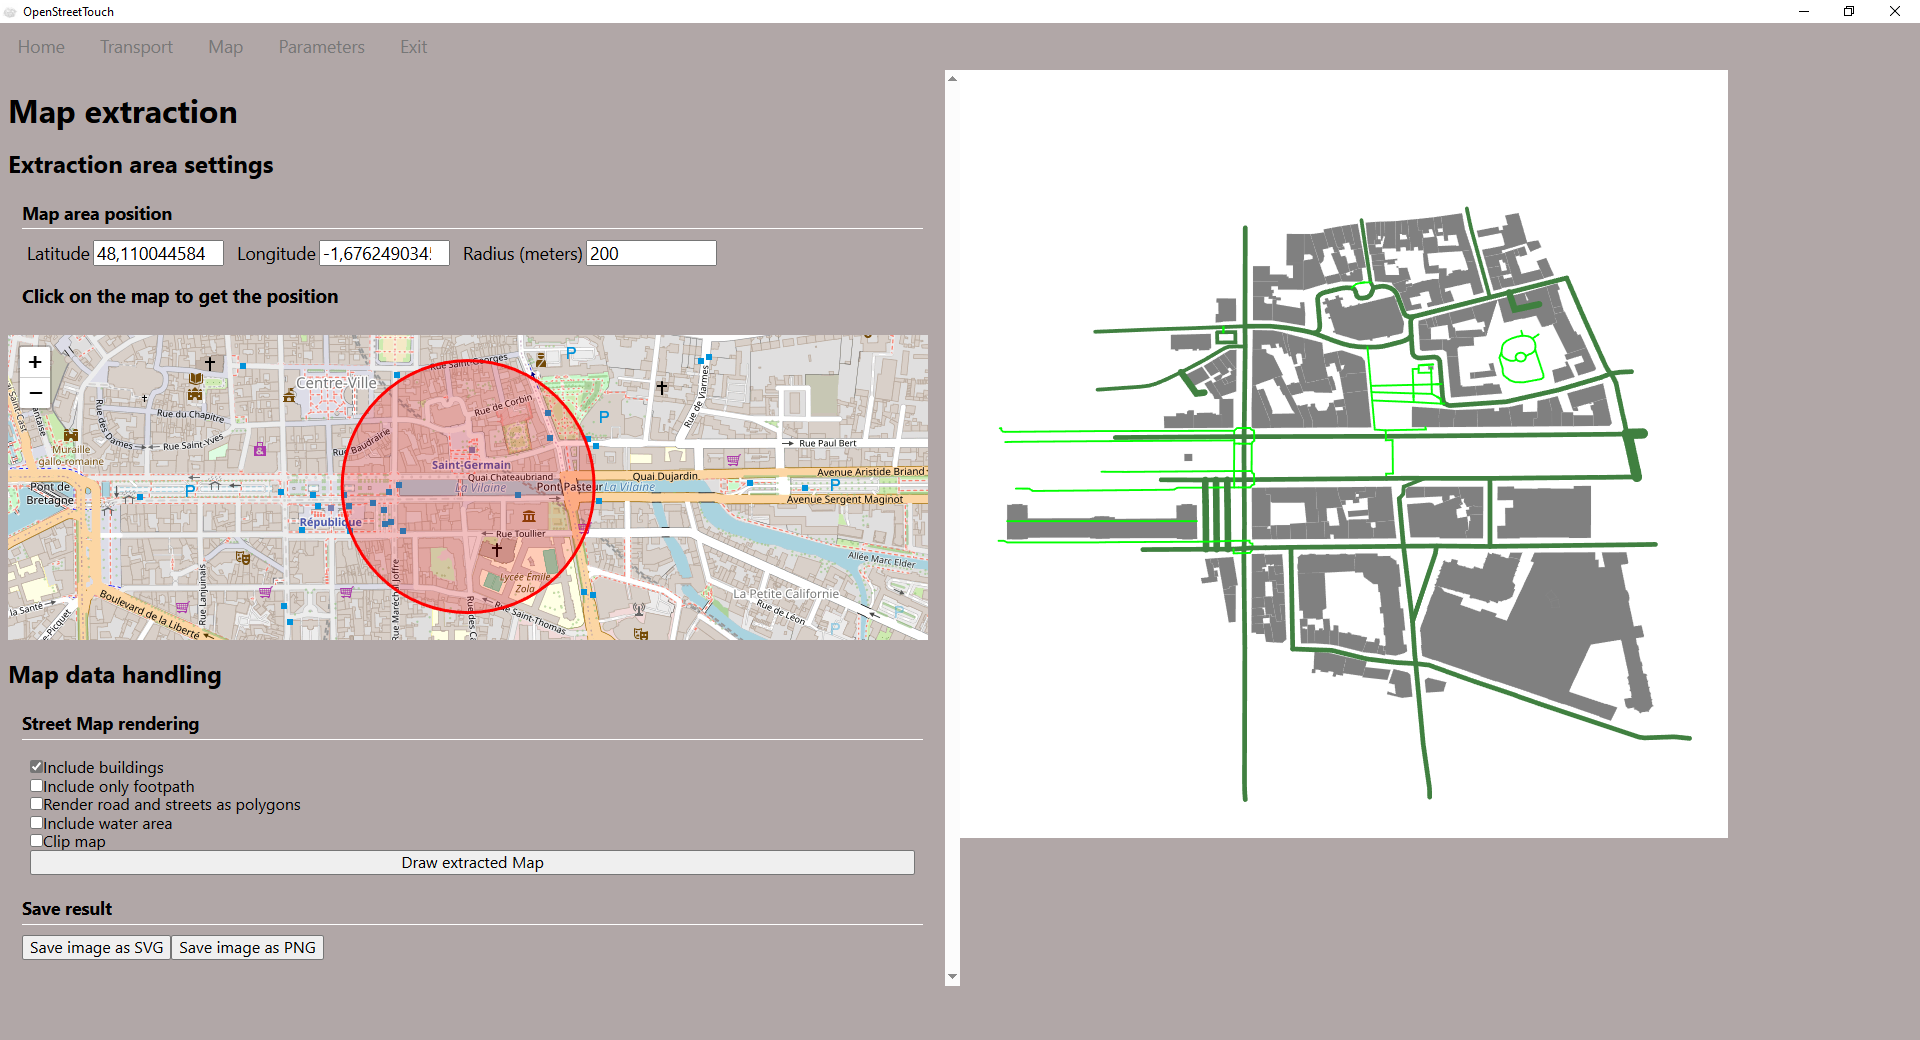
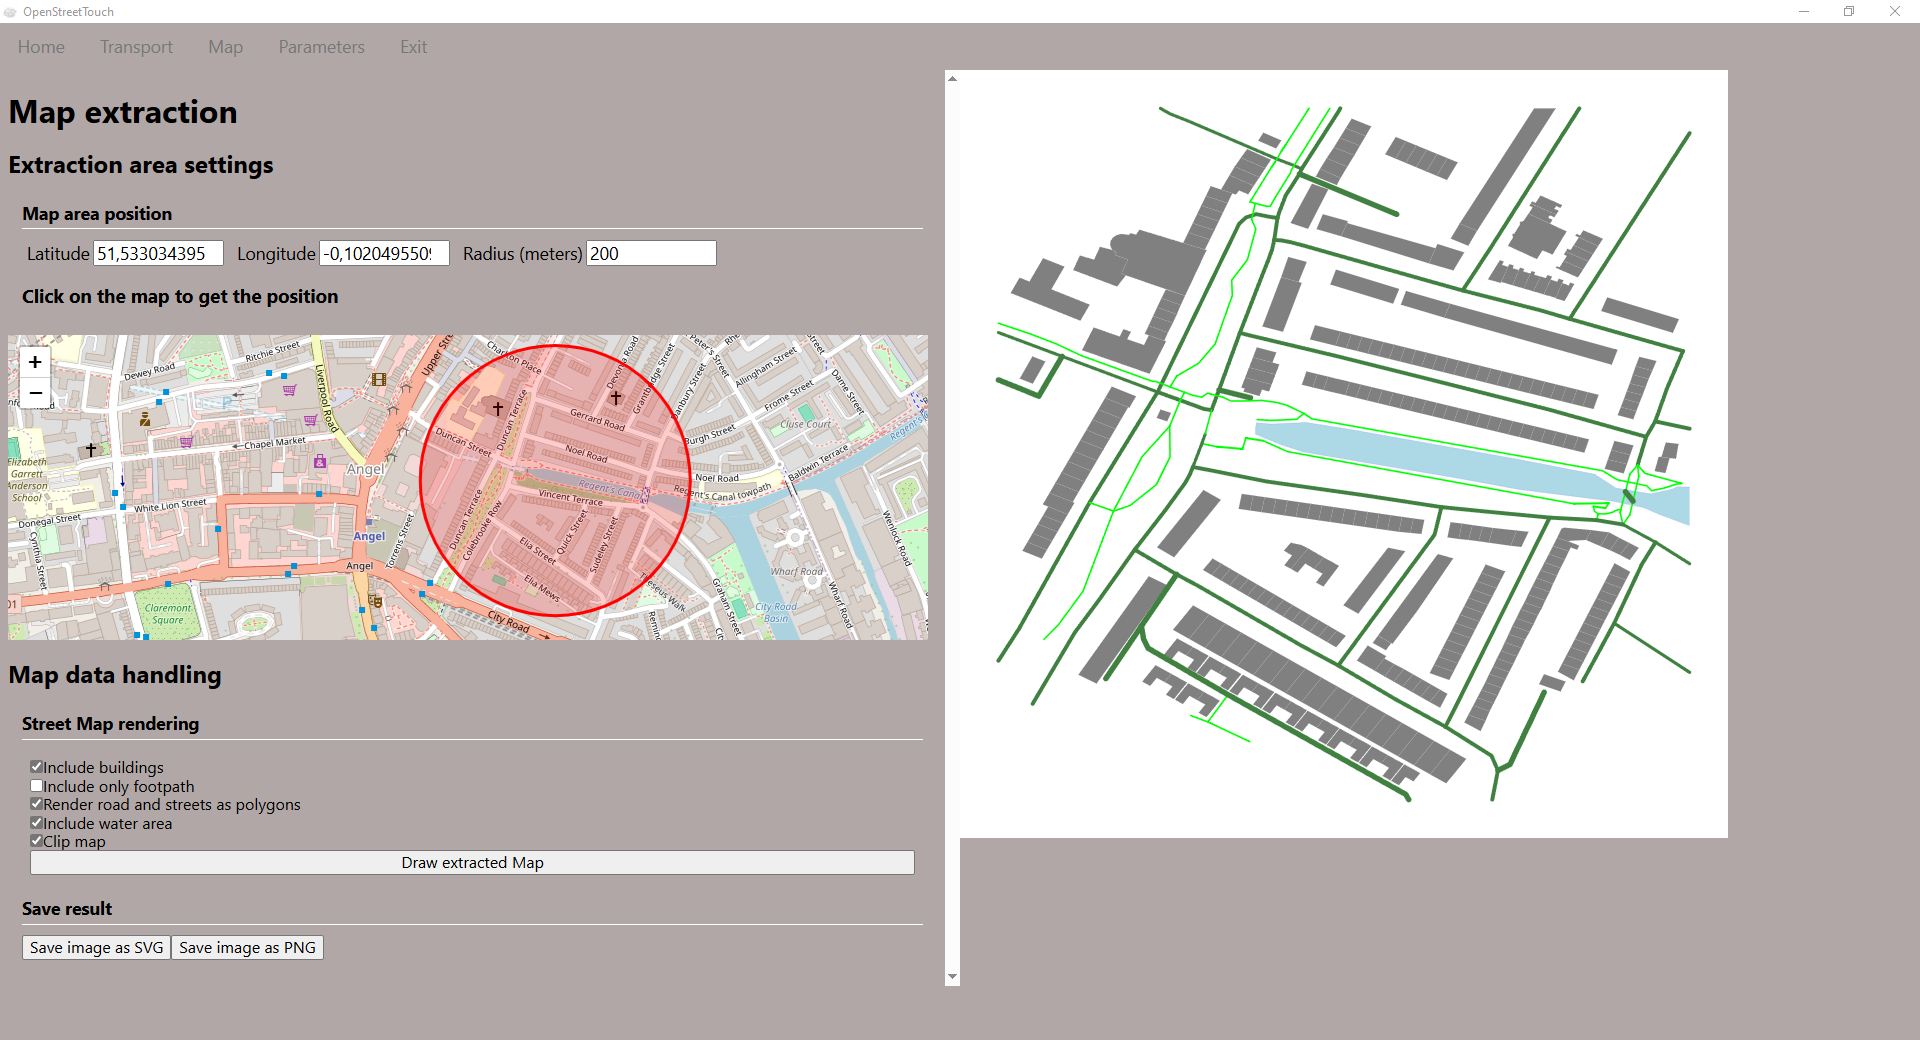
 *Example of map rendering including buildings and pedestrian roads only in polygon mode for roads/paths
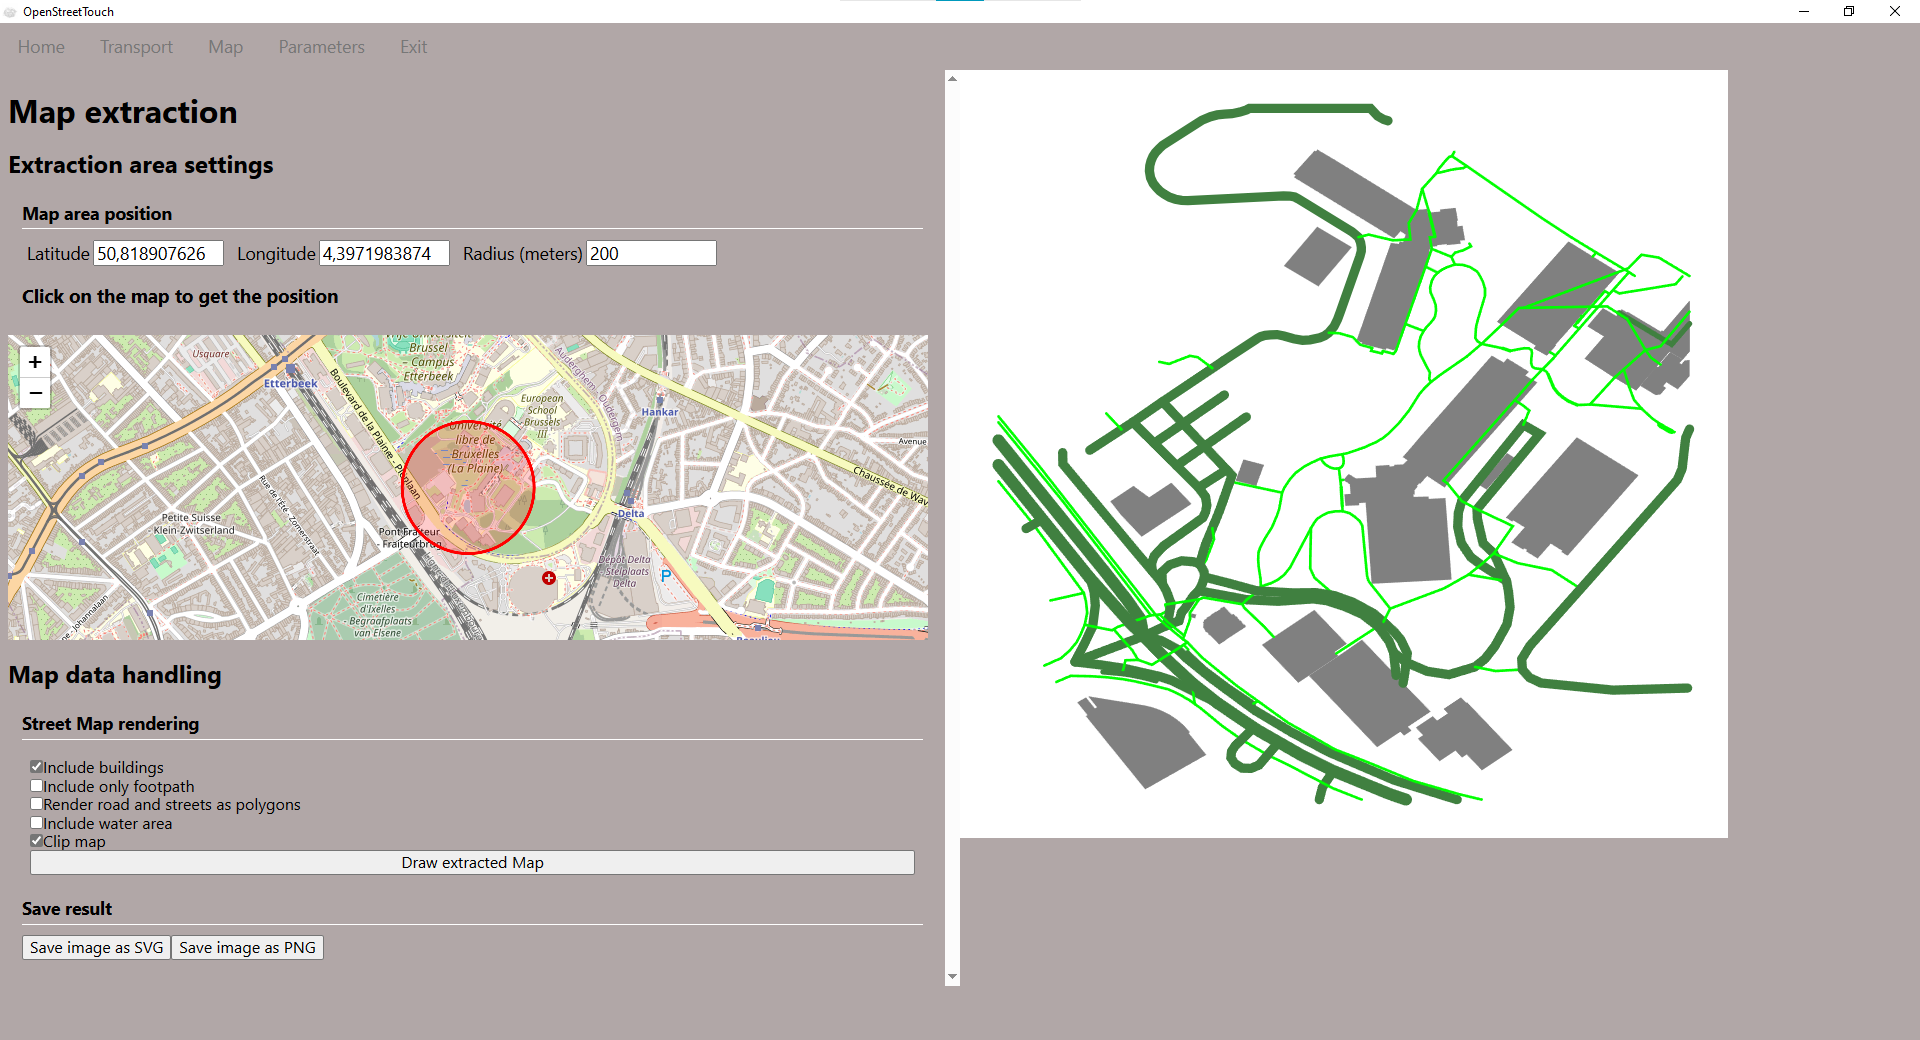
 Example with all options checked
Draw extracted map
Draw extracted map: Click on the button to generate the map and view it in the rendering window on the right
 Button to extract the area of the map
3-Save result
 Save image in the desired format : svg or png
Save image as SVG : Click on the button to generate the map in SVG format
Save image as PNG : Click on the button to generate the map in PNG format
Parameters
General parameters
Application language : Dropdown menu to choose the application language.
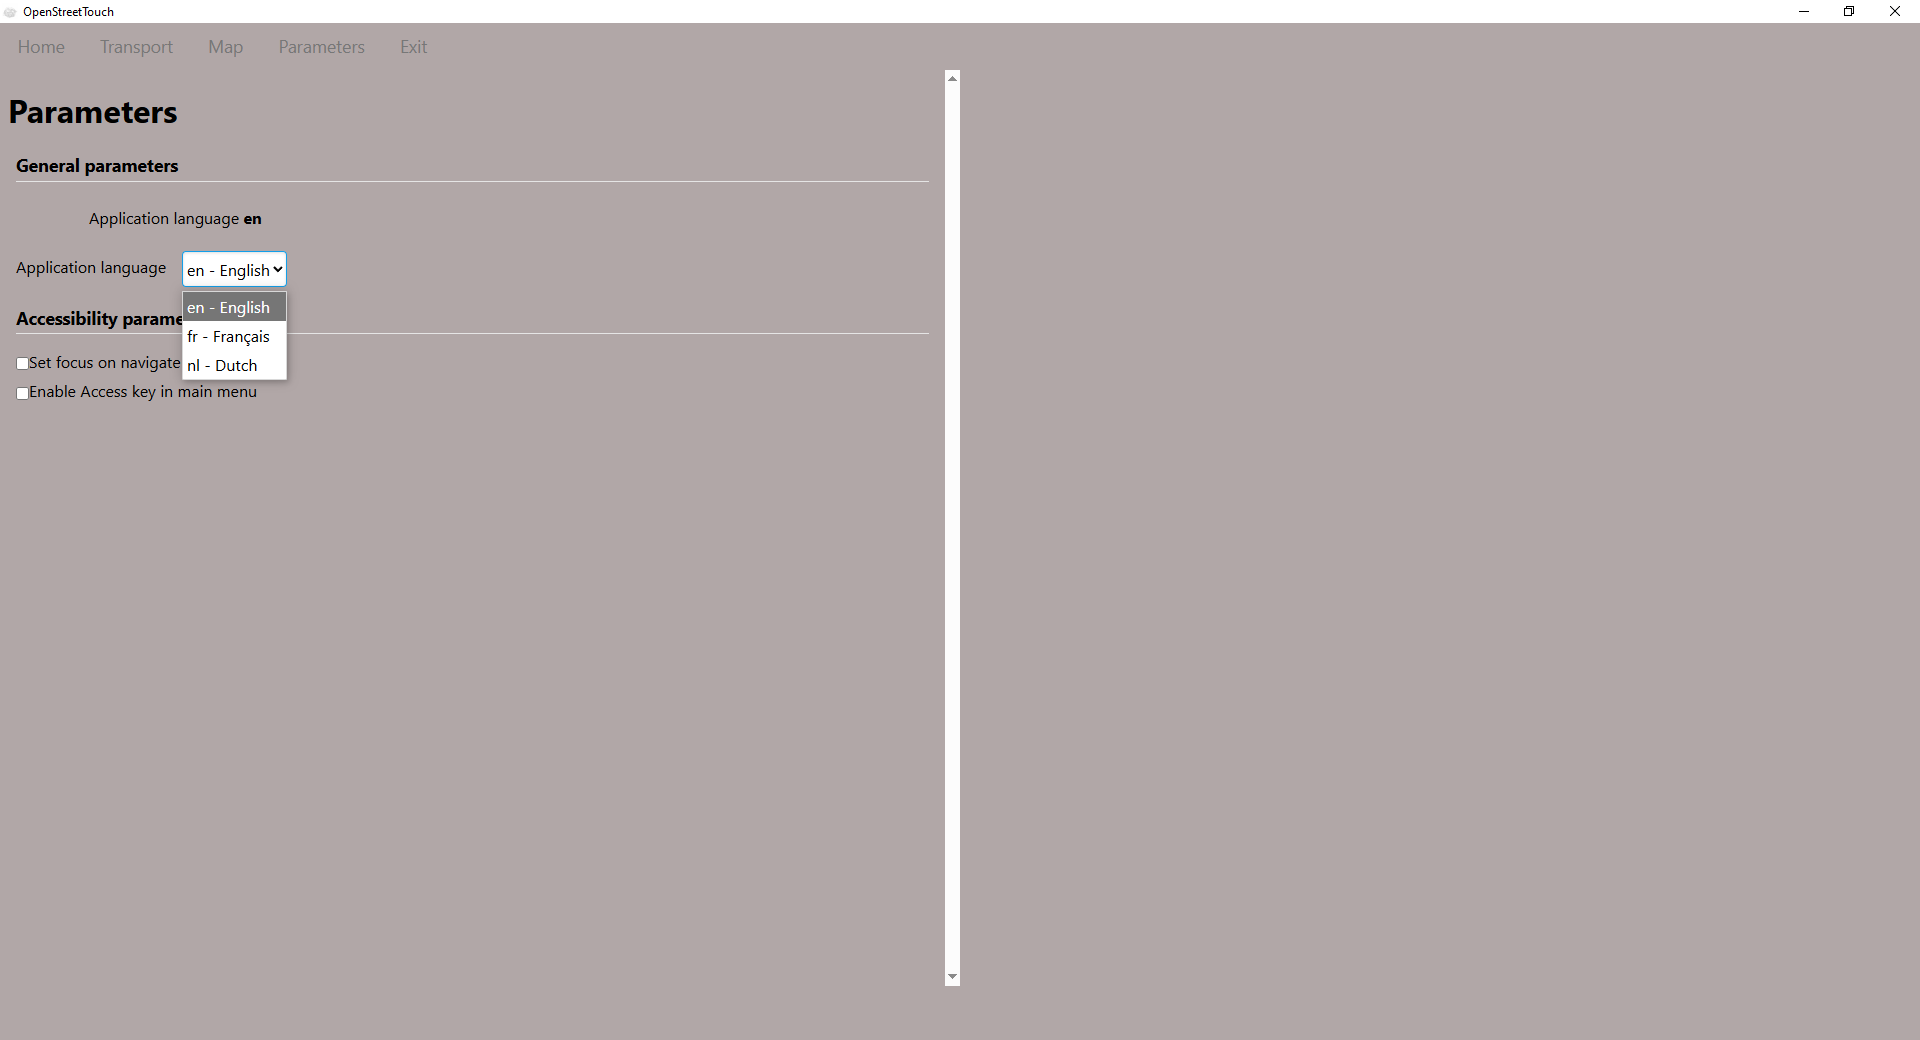 Language selection in the Parameters tab
Accessibility parameters
Set focus on navigate : Check this option to set the focus on the most used elements when navigating in the application.
Enable Access key in main menu : Keyboard shortcuts are very useful to allow a fast navigation. However they are difficult to translate in some languages and are sometimes incompatible with screen readers. You can use this option to enable or disable keyboard shortcuts in the main menu.
Exit
Exit the application : Click on the Exit tab to close the application
You will be asked for confirmation before exiting the application.